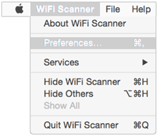
Preferences Menu
The Preferences Menu gives access to additional features, including showing or hiding specific columns in the information chart, changing graph views, and customizing speed test settings.
General Preferences
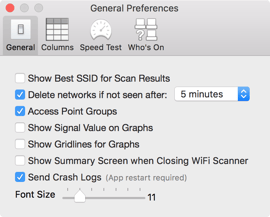
Show Best SSID for Scan Results - This allows devices that are on the same network (such as multiple routers or access points) to be combined into one result, displaying the one with the best signal.
Delete networks if not seen after – Clears old scanned information
Access Point Groups – Combines results that are from the same Access Point on the Graphs
Show Signal Value on Graph - Automatically add the signal values (RSSI values) to the time spots on the graphs for each network shown on the graph for “RSSI vs. Time”.
Show Gridlines for Graphs - Add gridlines to the x-axis and y-axis for all graphs.
Show Summary Screen when Closing WiFi Scanner - Turn on/off the pop-up summary screen seen when the app is closed.
Columns Preferences
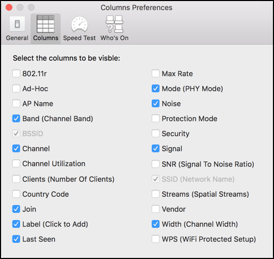
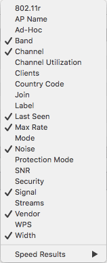
Simply right-clicking the column titles and checking/unchecking can hide the columns. The user can also toggle which ones are in view under the Preferences Menu.
Speed Test Preferences
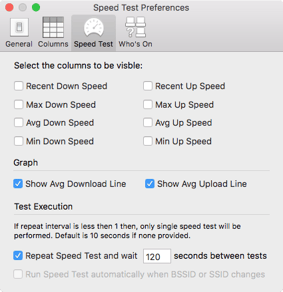
Show Avg Download Line / Show Avg Upload Line - Turn the dotted averages lines on/off for the Speed Test graph.
Repeat Speed Test - Allows the user to have continuous speed tests running with a wait time between entire test sets.
Run Speed Test automatically - allows the user to have speed tests running as they move across a network, such as one with multiple Access Points or varying networks.
Who's On Preferences
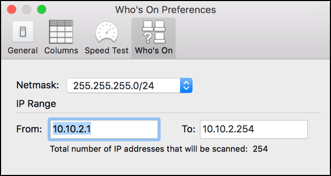
Preferences for the Who’s On My Network? tab include an IP Address range. By default it will choose the current subnet you are connected to and search all the IPs within that range X.X.X.1 – X.X.X.254. The default Netmask (255.255.255.0/24) is what most home networks use. It can be changed to shrink or enlarge the IP Range that will be scanned.
Other Features
Audio Tracking
Double Clicking on one of the networks will pop up a window that shows specific test results for a selected network, at particular intervals. This window also has a device location feature called Audio Tracking. When turned on, an audible beep will emit from the user’s machine in relation to the signal strength of a network device (router or access point). While moving the user’s machine (such as a laptop) around, the beep will become faster or slower depending on the strength of the signal. The faster the beep, the closer the machine is to the actual network device.
This feature is used to find rogue agents that might be hidden, for example, in walls or ceilings.
![]()
Exports and Reports
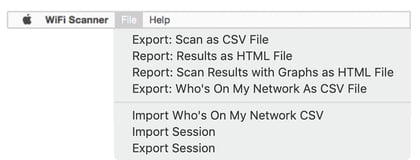
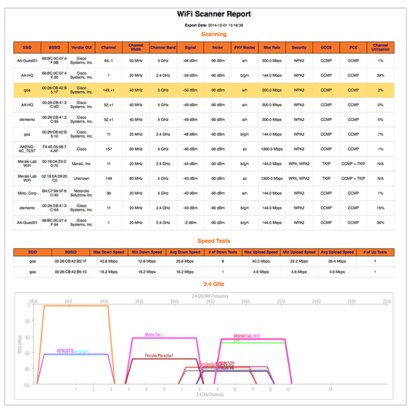
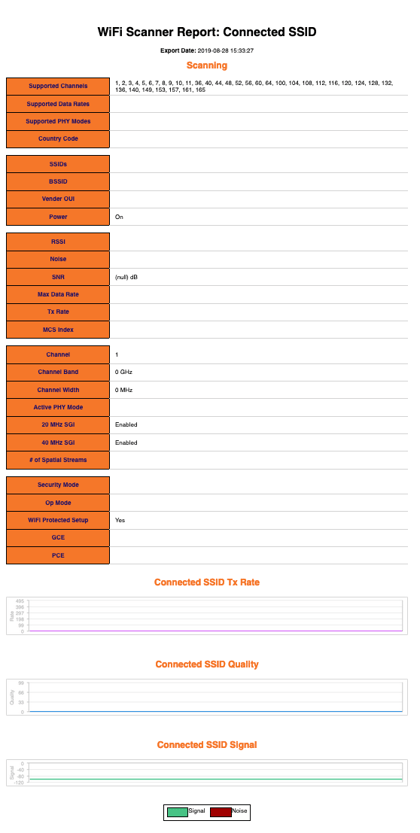
Exporting the scan results allows the user to send this information to administrators that need this information for troubleshooting network problems. Exports and reports come in CSV, HTML, and HTML with graphs formats.
Users can also Import / Export scan sessions / CSVs and use across platforms (Mac/Windows).
Scan Tab Preferences:

Connected SSID Tab Preferences:
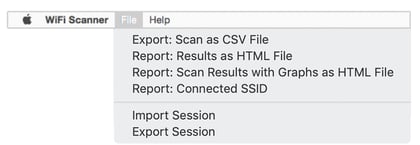
Who's On My Network? Tab Preferences:
Export Scan Results with Graphs as HTML Example:
Export Connected SSID Example:
Exported Scan Results CSV Example:

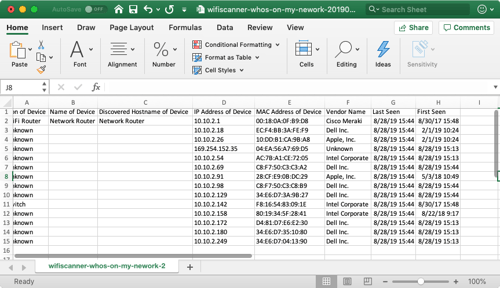
Exported Who's On My Network Results CSV Example:
